LT
Tuesday, July 24, 2012
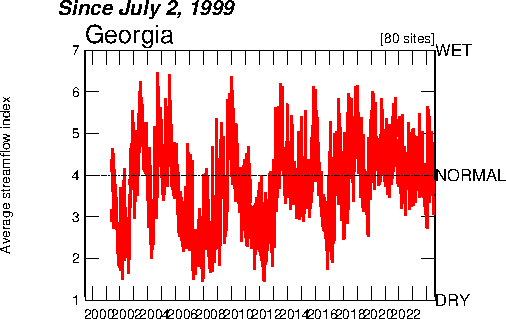
Index value plot
http://waterwatch.usgs.gov/regplots/real/real_ga_2.gif
The Index value plot displays a current statistic against the same historical static to show discrepancies. Above is the water usage over a period of time is plotted to show variance.
No comments:
Post a Comment
Newer Post
Older Post
Home
Subscribe to:
Post Comments (Atom)

No comments:
Post a Comment