Problem solutions maps are used to help solve an issue and can be used by anyone. Above is a map which shows the steps for product managers or marketers to take to find a solution to a problem.
Political maps show the governmental boundaries between countries, cities, states etc. As shown in this map different colors are used to separate the political boundaries.
Road maps show major highways, roads, and cities. When planning a trip a road map is helpful for planning driving directions. Above is a detailed road map of London.
Physical maps show the physical features of an area such as mountains, rivers, lakes. In this physical map of South American mountain ranges, rivers, plains are displayed.
A resource map is a map that shows natural resources in a certain area. This map is a map shows energy resources in the western part of the United States.
A parallel coordinate graph is a graph of multivariate datausing parallel lines to indicate a variable with lines
branching between them to indicate the data of that variable. This graph shows 10 variable being X1-X10 and the interplay
between them represented by the multitude of lines.
Triangular plot is a graph of 3 variables with varying amounts of independence,
only 2 variables must be known to find its graphic location. This triangular plot show the relationship between three
chemicals.
Windrose is a diagram to display wind speed and direction over a period
of time using a subdivided circle depicting the compass with varying length
bars indicating the direction and speed of wind. This Wind Rose graph shows the varying wind conditions in
both direction and speed.
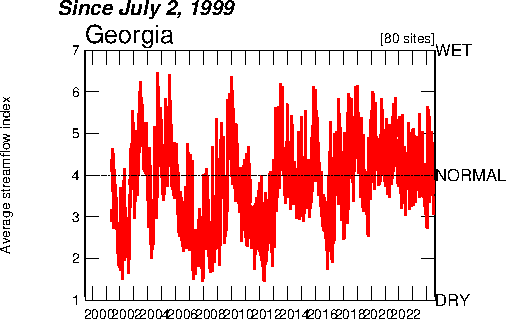
The Index value plot displays a current statistic against the same historical
static to show discrepancies. Above is the water usage over a period of time is plotted to show
variance.
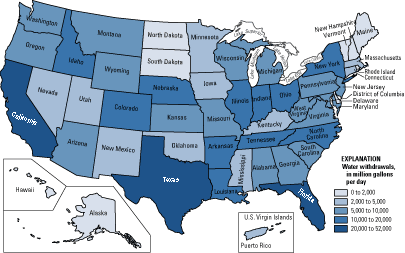
Series of choropleth maps that utilizes raw numbers instead
of standardized data. This map show actual information, it has not been
standardized in any way.
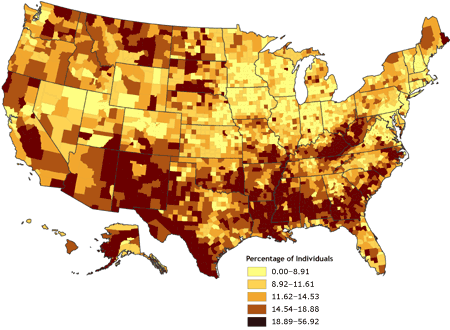
A choropleth map that including a classed frequency legend
with a frequency histogram and shading. This choropleth map
shares a class frequency size between the 4 different choropleth maps
A proportional circle map that uses several distinct circle
sizes to depict a range of the specified data. In this map the population of German ancestry in parts Chicago, IL is represented by the size of the circle.
The Lorenzo curve is used to represent inequality in the distribution of two variables. Information from a table was made into the above Lorenzo code representing the inequality in the distribution of income.
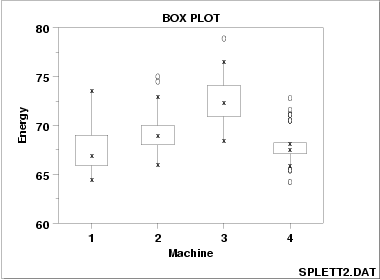
A box plot is a depiction of a set of data measured on an interval scale
that shows distribution, mean, and standard deviation. This box plot shows the
energy efficiency of 4 different machines under different load settings.