Windrose is a diagram to display wind speed and direction over a period
of time using a subdivided circle depicting the compass with varying length
bars indicating the direction and speed of wind. This Wind Rose graph shows the varying wind conditions in
both direction and speed.
Tuesday, July 24, 2012
Windrose
http://www.vistadatavision.com/uploads/images/Gallery/Wind_Rose_Distrubution/wind_rose_vector_1.png
Population profile
http://www.aaiusa.org/page/-/Images/Demographics/FL_PopulationGrowth.png
A population profile is graphic overview of certain key demographic statistics. This graph shows the growth of Arab Americans in the United
States.
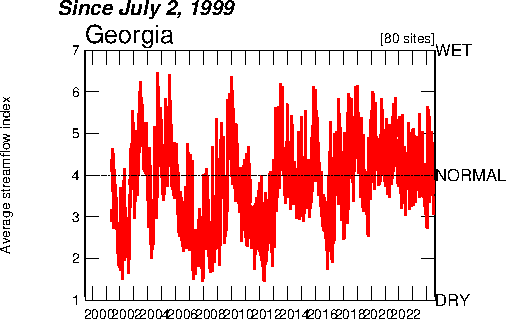
Index value plot
http://waterwatch.usgs.gov/regplots/real/real_ga_2.gif
The Index value plot displays a current statistic against the same historical
static to show discrepancies. Above is the water usage over a period of time is plotted to show
variance.
Nominal area choropleth map
http://my.ilstu.edu/~jrcarter/Geo204/Choro/Tom/hispanic_race_fl-H1_FINAL.gif
Choropleth map utilizing nominal data.
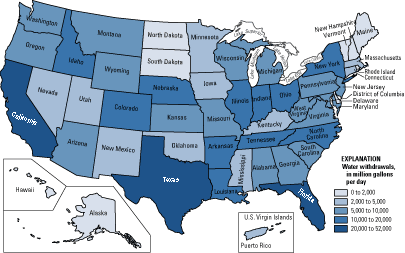
Unstandardized choropleth maps
http://pubs.usgs.gov/fs/2005/3051/images/2000choropleth.gif
Series of choropleth maps that utilizes raw numbers instead
of standardized data. This map show actual information, it has not been
standardized in any way.
Standardized choropleth maps
http://ars.sciencedirect.com/content/image/1-s2.0-S0167587712000396-gr3.jpg
Series of choropleth maps with standardized data to allow
comparison. This choropleth map
utilized standard ratios to allow for easy comparison.
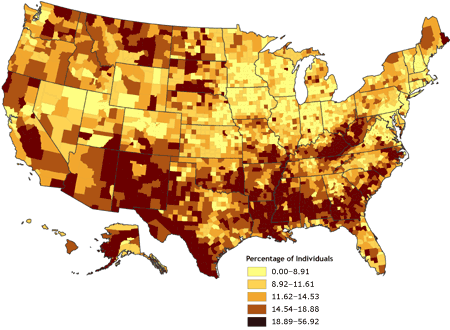
Univariate choropleth maps
http://www.cdc.gov/pcd/issues/2007/oct/images/07_0091_02.gif
A choropleth map that displays data from a single variable.
Subscribe to:
Posts (Atom)